
Methodology for Estimated Energy Savings
Cost-Effective Air Sealing and Insulating Savings Estimates
EPA estimates that homeowners can save an average of 15% on heating and cooling costs (or an average of 11% on total energy costs) by air sealing their homes and adding insulation in attics, floors over crawl spaces, and accessible basement rim joists. This estimate is based on energy modeling of cost-effective improvements made to ’typical’ existing U.S. homes with a weighted composite of characteristics (using Beacon Residential™). The modeled results are corroborated by the field experience of professional building science contractors who have done air sealing and insulation work for more than 20 years.
Establishing a 'Typical' U.S. Existing House
The Residential Energy Consumption Survey (RECS) from the U.S. Energy Information Administration indicates that a large block of existing U.S. housing stock was constructed after the 1973 oil embargo, when there was a new increased awareness of energy use in homes. As a result, EPA based its modeling around the common construction characteristics of homes built in this era as a proxy for a ’typical’ existing U.S. home.
Construction characteristics for homes built during this era (1970 to 1989) were determined based on a review of the RECS and data from Lawrence Berkeley National Laboratory, as well as other supporting data, including professional experience of ENERGY STAR staff and stakeholders. Based on these sources, EPA assumed the following characteristics for a house from the 1970 to 1989 era:
- 1,700 square feet of conditioned floor area;
- 15% window-to-floor-area ratio;
- 23% total system duct leakage;
- Four bedrooms; and
- "Stick" construction (wooden studs, joists and rafters), with batt insulation in walls and blown insulation in attics.
Geographic climate factors, regional construction styles (e.g., basement, crawl space or slab-on-grade), and fuel type characteristics (e.g., natural gas or electricity) were then proportionally weighted using the Residential Energy and Costs Analysis Methodology from the U.S. Department of Energy. Estimated energy use was then calculated for "typical" composite houses in all U.S. climate zones using Beacon Residential™, a proprietary energy model that uses the nationally recognized DOE-2 hourly simulation software.
Estimating Energy Savings from Improvements Made to the ’Typical’ Home
For the purpose of estimating energy savings, EPA assumed that a knowledgeable homeowner or contractor could cost-effectively:
- Seal air leaks throughout the house, focusing on leaks to the attic space, through the foundation, and around windows and doors to achieve a 25% reduction in total air infiltration.
- Add insulation to improve R-values in attics, floors above unconditioned basements and crawlspaces, and basement walls to meet the 2012 International Energy Conservation Code insulation requirements.
- Estimated savings are higher in the North than the South due to geographic climate factors, regional construction styles, and fuel type characteristics.
Figure 1: Continental U.S. Climate Zone Map
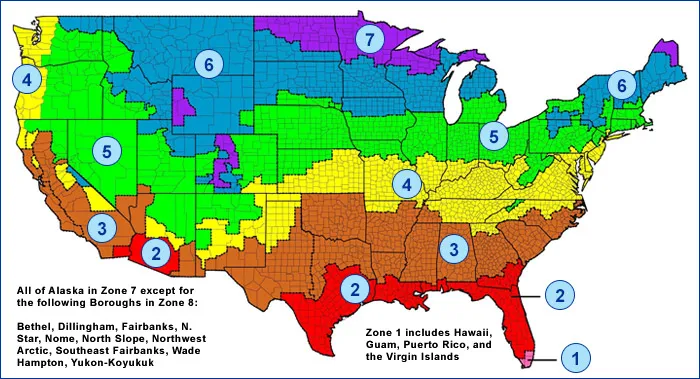
Table 1: Estimated Savings from Home Sealing and Insulating
| Location | Climate Zone | Estimated Annual Utility Bill Savings (%) | |
|---|---|---|---|
| North | CZ 8 | Total House | 16% |
| Heating and cooling only | 18% | ||
| CZ 7 | Total House | 15% | |
| Heating and cooling only | 19% | ||
| CZ 6 | Total House | 14% | |
| Heating and cooling only | 18% | ||
| CZ 5 | Total House | 12% | |
| Heating and cooling only | 16% | ||
| CZ 4C | Total House | 13% | |
| Heating and cooling only | 20% | ||
| CZ 4 | Total House | 12% | |
| Heating and cooling only | 17% | ||
| South | CZ 3 | Total House | 8% |
| Heating and cooling only | 14% | ||
| CZ 2 | Total House | 6% | |
| Heating and cooling only | 9% | ||
| CZ 1 | Total House | 5% | |
| Heating and cooling only | 7% | ||
| National Average | Total House | 11% | |
| Heating and cooling only | 15% | ||